
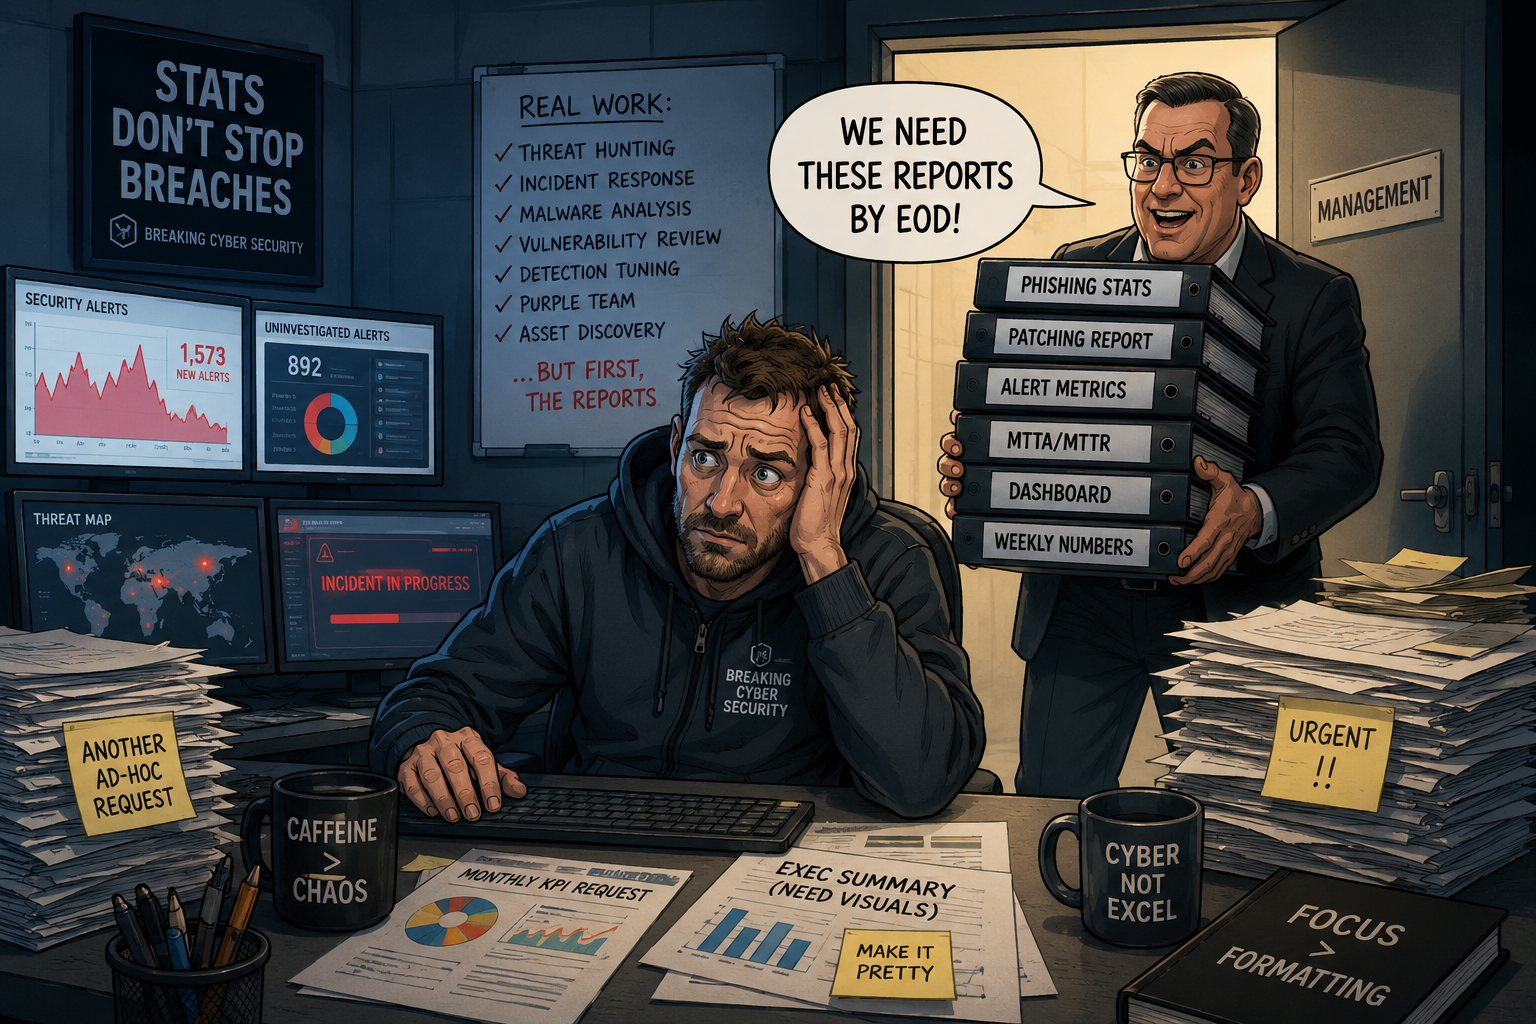
Metrics matter.
Stats-for-stats’-sake is where cyber work goes to
die.
There is nothing wrong with measuring cyber security.
A serious security function needs evidence. It needs to know whether alerts are
being handled, whether vulnerabilities are being remediated, whether phishing
reports are being reviewed, whether endpoint coverage is slipping, whether
incidents are taking too long to detect, and whether controls are doing what
people claim they are doing.
The problem starts when measurement becomes the work.
In too many organisations, cyber teams are interrupted by a steady flow of
‘quick’ requests for figures. A manager wants a new chart. A project wants a
status pack. Governance wants a different view of the same data. Someone
senior has seen a dashboard somewhere else and now wants one by Friday.
The request is rarely framed as operational work, but that is exactly what it is.
Someone has to stop doing security work, work out what the requester actually
means, find the data, clean it, argue with the tools, explain the exclusions, and
package it into whatever format has been invented this week.
That is not free. It costs time, focus, and analyst attention. In a cyber team, those are not minor costs. They are the raw materials of defence.
The issue is not metrics. It is random
metrics.
This is not an argument against monthly reporting or sensible cyber
measurement. Good metrics have a place. In fact, monthly figures can be useful
precisely because they help show whether important work is being missed,
whether controls are drifting, and whether the same operational problem keeps
coming back.
The problem is random metrics. Stats-for-stats’-sake. A request made quickly
because someone wants a number, without stopping to ask what decision the
number will support, who will own the action, or whether the figure is even
meaningful. Sometimes the requester is not interested in the underlying
condition at all. They are interested in the perception created by the report.
That distinction matters.
Mean time to detect (MTTD), mean time to acknowledge (MTTA), mean time
to triage, mean time to respond or remediate (MTTR), mean time to close
(MTTC), patching performance, endpoint coverage, alert quality, false
positives, control failures, incident trends and vulnerability remediation can all
tell a useful story when they are properly defined. The words ‘properly defined’
are doing a lot of work there. MTTR, for example, is used differently across
organisations. It can mean response, recovery, repair or remediation. If the
report does not say which one it means, the number is already wobbling.
NIST’s measurement guidance is about building an information security
measurement programme, including programme scope, roles, communication,
measures selection and data management. It is not an invitation to invent a
random figure every time someone wants a slide.
CIS makes a related point from the control side. CIS Controls v8.1 are described as a prioritised set of safeguards to defend against prevalent cyber attacks. In other words, measurement should support defensive action, not sit on top of it as a disconnected reporting ornament (NIST, 2024; Center for Internet Security, 2024).
A useful metric is tied to risk, ownership, action and improvement. A bad
metric exists because someone wanted a number.
Cyber teams do not usually object to measurement because they are hiding
something. They object because poor measurement creates work without
improving security. Worse, it often creates the appearance of control while the
real operational cracks remain untouched.
‘Can you just get me a stat?’
The phrase sounds harmless. It rarely is.
‘Can you just get me a stat?’ often means: stop what you are doing, find out
which system might contain the answer, discover that it does not quite contain
the answer, export the data, remove duplicates, explain why two tools disagree,
manually stitch fields together, shoehorn half-compatible fields into the
requested format, or build a small algorithm from several bits of information
just to work out the actual number.
Then check whether the result is defensible and turn it into something management can consume. Sometimes it takes half an hour. Sometimes it takes a week. Sometimes it becomes a standing report that nobody properly reads but everyone is afraid to stop producing.
The people asking often assume the numbers are sitting neatly in a system
waiting to be pulled. Sometimes they are. Often they are not. Security tooling is
rarely as joined-up in practice as it looks in procurement decks.
Asset inventories are incomplete. Logs are inconsistent. Incident classifications vary. Endpoint coverage has exclusions. Vulnerability data depends on scan scope. Ticket closure does not always mean risk closure. This is the messy reality under the dashboard. And when this keeps happening, the analysts have probably already said the quiet part out loud several times: the reporting systems are no longer fit for purpose. They are not refusing to help. They are pointing at a failed reporting model that has been normalised.
The absurd bit is that the industry is now talking about AI agents, automation
and robotics, yet many organisations still cannot sync their basic security systems well enough to produce reliable monthly figures without dragging
analysts away from live work. The tools were supposed to collect, correlate and
process numbers. That was part of the point.
Microsoft Sentinel, for example, provides incident metrics and workbooks
intended to help Security Operations Centre (SOC) managers report on incident
trends, severity, owner, status, mean time to triage and mean time to closure. It
also allows custom KQL queries against incident data (Microsoft, 2026).
That does not mean every organisation has reporting solved. It does show that
reporting should not depend on a SOC analyst manually rebuilding the same
pack every month.
The catch is that not every organisation runs a neat, modern stack. Many use
bespoke platforms, inherited tools, half-integrated case systems, supplier
portals and spreadsheets that grew out of a panic years ago. Some tools have
metrics. Some have poor metrics. Some have reporting that looks useful until
someone asks a slightly different question. That is not an excuse to dump the
problem on analysts. It is an argument for proper reporting engineering.
If the business wants regular cyber statistics, build a reporting function. Give it
the access, tooling, data engineering support and cyber context it needs. For
one SOC, this may not require a huge new empire.
Sometimes one or two dedicated reporting analysts, data engineers or statisticians would protect a whole team from constant churn. Their job should be to know where the data lives, understand its limits, automate the reports, and stop the same questions being rebuilt from scratch.
Let analysts analyse threats.
When bad numbers get punished, good
numbers become fiction
There is another problem that does not get said enough. Management often
likes numbers until the numbers get worse.
A deteriorating metric should start a conversation. It should prompt questions.
What changed? Was there a tooling failure? Did attack complexity rise? Did
the team finally start recording something properly? Did the scope change? Is
the workload bigger? Are the people on the ground telling us something we
have been ignoring?
Too often, the answer is less mature. The people producing the stats get it in the
neck. The number becomes a stick. The person who surfaced the problem
becomes the problem. That is how organisations teach people to make the
graph look better rather than make the environment safer.
The messenger should be praised for highlighting the issue, not punished for
proving that it exists.
If leadership only wants numbers that improve, it does not want measurement.
It wants reassurance. Keep doing that for long enough and the organisation
ends up with a fragile house of cards: pretty from the outside, weak underneath,
and waiting for the first hard shove.
That matters because useful measurement is supposed to expose weakness. A
number going the wrong way may be the most valuable thing in the report. It
may be the first honest signal that a process is broken, a team is under-resourced, a tool is blind, or a control is not working.
Punish the messenger and the next report will be tidier. It will also be less true.
This does not mean bad figures should be ignored forever. If a metric stays
poor over time and nobody acts, then accountability is required. But accountability is not a ceremonial beheading.
The question should be: what is the reason, who owns the fix, what support is needed, and why has the organisation allowed the condition to persist?
The answer is rarely ‘blame the analyst’.
An analyst can report that change is needed, but they seldom have the authority, budget or ownership to make that change happen. Act on the reason, not the stat and do not confuse the individual who surfaced it with the system that caused it.
The graph is not the control. The report is not the defence.
A dashboard can show activity.
It does not prove security.
A chart can show that alerts were closed.
It does not prove they were investigated well.
A phishing report can show training completion. It does not prove staff will
report real attacks. It helps, but on its own it is not enough.
There is also a trap here. If the organisation rewards reporting volume without
looking at quality, users can end up reporting everything: newsletters,
marketing emails, odd internal messages, and every harmless thing that looks
slightly weird. That sounds safer until the SOC is buried under low-value
phishing submissions and analysts have to spend more time sorting noise from
threat. Encouraging reporting matters.
Turning report volume into a trophy can bury the actual malicious email in the pile. A vulnerability report can show a high remediation percentage. It does not
prove the exposed, business-critical, internet-facing systems are fixed.
A patching chart can look green while the exceptions contain the actual risk.
And they usually do.
This is where cyber metrics become dangerous. They stop being a lens and
become a shield. People point at the number instead of asking whether the
control works.
Goodhart’s Law has a badge and a
spreadsheet
Goodhart’s Law is often paraphrased as: when a measure becomes a target, it
stops being a good measure. Oxford Reference records Goodhart’s original
point as the collapse of a statistical relationship once pressure is placed on it for
control purposes (Oxford Reference, n.d.).
In plain English: when people know they are being judged by a number, they
will start optimising for the number. That may be sensible human behaviour. It
is also dangerous in a SOC.
If analysts are judged mainly on ticket closure, tickets will close. That does not
mean the environment is safer. If phishing teams are judged mainly on lower click rates, simulations may get easier, users may get coached into spotting the test, and the organisation may learn very little about real attacker behaviour.
If vulnerability teams are judged mainly on percentage remediated, effort may
drift towards easy closures rather than the ugly, high-risk systems that actually
matter.
If incident response is judged only on speed, teams may feel pressure to close
quickly rather than investigate properly. That can damage the investigation, the
process, the procedure and ultimately the protection of the business.
A fast, shallow closure is not a win. It is a liability with a timestamp.
The number improves. The defence does not.
That is not governance. That is theatre with a spreadsheet.
The Equifax lesson was not ‘more
dashboards’
The Equifax breach remains useful here because it was not just a technical
failure. It was a governance, measurement and operational failure.
The short version is ugly.
In 2017, attackers exploited a known Apache Struts vulnerability in Equifax’s online dispute portal. The patch had been available months earlier. According to the US House Oversight Committee, the breach was ‘entirely preventable’. The committee pointed to outdated and complex IT, weak accountability, an execution gap between policy and operation, and a failure to implement responsible security measurements (US House Committee on Oversight and Government Reform, 2018).
One detail is especially relevant to this article. Equifax had allowed more than
300 security certificates to expire, including 79 certificates for monitoring
business-critical domains. One expired certificate left the company without
visibility into data exfiltration during the attack (US House Committee on
Oversight and Government Reform, 2018).
That is what responsible measurement should catch. Not because a certificate
expiry chart looks impressive in a pack, but because the expiry represented a live control failure. The monitoring was not able to see what it needed to see.
The reportable thing was not the number of certificates. The reportable thing
was the loss of visibility over business-critical monitoring.
The lesson is not that every organisation needs more dashboards. The lesson is
that organisations need the right measurements, tied to the right controls,
watched by the right people, with consequences when the numbers show
something is broken.
And consequences should not mean simply firing a few people so their
replacements can smile, nod and give leadership a thumbs up. Accountability
means fixing the system that allowed the failure to sit there. It means asset
ownership, patch validation, certificate management, monitoring coverage,
escalation, and evidence that the control has actually recovered.
Mature on paper. Blind in practice.
The gap between appearance and reality is not theoretical.
In 2022, CISA conducted a red team assessment against a large critical
infrastructure organisation with multiple geographically separated sites. The
organisation had what CISA described as a mature cyber posture. The red team
still gained persistent access, moved laterally across multiple sites, and reached
systems adjacent to sensitive business systems. The organisation did not detect
the activity during the assessment, including when the red team tried to trigger
a security response (CISA, 2023).
That is the reality dashboards often fail to show.
You can have a mature-looking programme. You can have defined processes.
You can have tools. You can have governance packs. You can have a confident
score.
Then a red team turns up and nobody sees them. Or nobody is actually ready
for them.
That should bother people far more than whether last month’s pie chart used the
right colours. Because if the SOC has spent its time doing someone else’s
reporting job, it has not spent that time testing detections, improving runbooks,
reviewing weak signals, validating log sources, or asking whether the whole
estate is actually monitored from top to bottom.
The issue is not whether the organisation can produce security metrics. The
issue is whether those metrics describe actual defensive capability.
Do the tools detect lateral movement? Are logs being collected from the
systems that matter? Is the entire company infrastructure monitored, or only the
parts that were easy to onboard? Are analysts given enough time to investigate
properly? Are detections tested? Are incidents reviewed for missed opportunities? Are the assets in scope actually covered? Can the SOC see the
attacker, or only the ticket queue?
Those questions are harder than ‘how many alerts did we close and how
quickly?’ They are also much more useful.
This is where value-for-money reporting can become dangerous. Value for
money matters. No serious organisation can ignore cost. But if value-for-money reporting only counts volume, speed and closure, it may measure the cheapest visible activity rather than the defensive capability the business actually needs.
Urgency is not management shouting
During an incident, analysts already know that time is precious. It is their bread
and butter.
What does not help is management suddenly arriving with a new sense of
urgency, demanding extra figures, fresh timelines, and repeated status updates
while the people doing the work are already on edge.
That does not make the incident more urgent.
It makes it noisier.
This is not an argument for silence during an incident. Leadership needs
situational awareness. Legal, comms, service owners and executives may all
need accurate information. But there is a difference between disciplined
incident communication and everybody taking a bite out of analyst time
because they want to feel close to the action.
The useful question is: what do you need from us? The useless question is: can
you just send me another quick stat before the call?
Attackers are not waiting for the reporting
pack
This matters because defenders are not operating in a quiet environment.
The 2026 Verizon DBIR reported that 31 percent of breaches now start with
software vulnerabilities, ahead of stolen passwords as the top way attackers get
in, and that 48 percent of breaches involve ransomware (Verizon, 2026).
Google Cloud’s Mandiant M-Trends 2026 report said exploits remained the
most common initial infection vector for the sixth consecutive year, accounting
for 32 percent of intrusions. It also reported that the median time between an
initial access event and hand-off to a secondary threat group collapsed from
more than eight hours in 2022 to just 22 seconds in 2025 (Google Cloud, 2026).
That is the operational context.
Attackers are moving faster. Exploitation windows are shrinking. Ransomware
groups are targeting recovery as well as production. Edge devices, VPNs and
routers are being abused because they often lack normal endpoint telemetry.
SaaS platforms are being attacked through long-lived OAuth tokens, session
cookies, hard-coded keys, personal access tokens, supplier access and
help-desk social engineering.
Third-party routes matter because one weak supplier, one exposed integration, or one badly governed cloud tenant can become someone else’s breach path (Google Cloud, 2026).
Against that backdrop, pulling analysts away from investigations, tuning, threat
hunting, vulnerability validation and control improvement so they can feed
another spreadsheet is not harmless. It is not admin. It is not a harmless side quest. It is taking time from the people who are supposed to see, understand
and stop the attack.
Every hour spent building a one-off metric is an hour not spent improving
detection logic, reviewing suspicious activity, validating a control, clearing
high-risk exposure, or asking why yesterday’s alert did not fire.
Management often sees the chart.
The SOC feels the cost.
Attackers get AI. Analysts get another
spreadsheet.
This is the imbalance that should make leadership uncomfortable.
The NCSC assessed in 2024 that AI would almost certainly increase the
volume and heighten the impact of cyber attacks over the next two years. It also
judged that AI gives threat actors uplift in reconnaissance, social engineering
and exfiltration, and lowers the barrier for less-skilled actors to carry out
effective access and information-gathering operations (NCSC, 2024).
That is no longer just a future-facing concern. Anthropic reported in August
2025 that it disrupted a cybercriminal data-extortion operation where Claude
Code was used to automate reconnaissance, credential harvesting and network
penetration, with at least 17 organisations targeted across sectors including
healthcare, emergency services and government (Anthropic, 2025a).
November 2025, Anthropic reported what it described as the first large-scale
AI-orchestrated cyber espionage campaign, saying AI was used to attempt
infiltrations against roughly 30 global targets and that a small number of
intrusions succeeded (Anthropic, 2025b).
Those are vendor reports and should be read as such. But the operational point
is still clear. Attackers are using automation and AI to reduce effort, increase
scale, and move faster through the attack chain. Meanwhile, too many
defenders are still manually rebuilding figures for whatever reporting pack has
appeared this week.
That is the wrong asymmetry. Analysts with less time, more context switching
and more artificial deadlines do not become sharper defenders. They become
easier to distract. And when the attacker can automate reconnaissance while the
analyst is reconciling spreadsheet columns, the reporting culture has become
part of the attack surface.
Slower does not always mean worse
This is also why metrics need interpretation. A number can move in the wrong
direction for the right reason.
Mean time to close (MTTC) might get worse because the team is lazy. It might
also get worse because the attacks are more complex, because analysts are
doing deeper investigations, because cases are being linked properly instead of
chopped into neat little tickets, or because management finally gave the team
the support to deal with issues properly rather than sweep them into closure
codes.
Mandiant’s 2026 reporting is a useful reminder of this. It reported that global
median dwell time rose from 11 days to 14 days, while internal detection also
improved from 43 percent to 52 percent. Those figures can sit together because
attacker behaviour, defender visibility and investigation quality all move at
once (Google Cloud, 2026).
A slower closure number does not automatically prove a worse team. It may
indicate more sophisticated attacks, better triage, better case handling, better
process, or a team finally refusing to pretend that shallow closure is the same as
proper investigation.
This is what gets missed when leaders stare at figures without understanding
the work underneath them.
Reporting load becomes a security risk
Cyber teams are already under pressure.
ISACA’s 2025 State of Cybersecurity work found that 55 percent of cyber
teams were understaffed and 65 percent had unfilled cyber positions. It also
found that 66 percent of cyber professionals said their role was more stressful
than five years earlier, with nearly half citing high stress as the top reason for
attrition (ISACA, 2025).
Sophos reported in 2025 that 76 percent of respondents had experienced cyber fatigue or burnout at least occasionally in the previous year, and that 69 percent said burnout had increased from 2023 to 2024 (Sophos, 2025). Object First also reported that 84 percent of IT and security professionals surveyed felt uncomfortably stressed at work due to IT security risks, and 78 percent feared being personally blamed for security incidents (Object First, 2025).
Cyber analysts are not standing still while all this happens.
The job already demands constant learning. New technologies arrive, old technologies expose new weaknesses, vendors change logging formats, cloud platforms shift, attackers adapt their tooling, and yesterday’s detection logic can become tomorrow’s blind spot.
Analysts have to keep sharpening their technical knowledge just to remain useful. That means understanding new systems, new attack paths, new vulnerabilities, new telemetry, new controls and new ways those controls fail in practice.
They also have to interpret threat intelligence, separate useful signals from recycled noise, threat hunt, tune detections, review incidents, understand business systems, support investigations, improve playbooks, validate controls and keep enough operational awareness to notice when something does not smell right.
That work takes time and concentration. It is not spare capacity.
So when another random reporting request lands, it does not interrupt an empty calendar. It steals time from the work that keeps analysts competent and the organisation defended.
Now add reporting churn.
Not planned reporting. Not useful measurement. Churn.
The random requests. The duplicated formats. The ‘we need this yesterday’
demands. The new dashboard that repeats an old dashboard but with slightly
different labels. The figures that go upwards because people have learned how
to satisfy the metric rather than improve the work.
That does not just irritate analysts. It changes behaviour.
People start optimising for the report. They chase the number. They close the
thing that can be closed. They prioritise visible work over important work.
They learn which stats make leadership happy and which awkward truths cause
meetings.
Reporting churn behaves like a slow infection inside the SOC. It does not look
dramatic on day one. It just eats away at the team’s efficiency until tiredness,
fatigue, resource strain and broken systems become normal. Then everyone
acts surprised when something finally collapses.
This is the same old management trick in a cyber wrapper: cut everything by 50
percent, demand 200 percent output, then ask why something was missed.
A green report can hide understaffing. It can hide weak asset data. It can hide
exclusions. It can hide poor detection coverage. It can hide fragile processes. It
can hide a team quietly drowning in work.
The colour changes. The risk remains.
What good measurement should look like
The fix is not to stop measuring. That would be childish.
The fix is to stop treating cyber teams as an on-demand stats factory.
Organisations need a standard reporting model with agreed definitions, agreed
sources, known limitations and a clear owner. Monthly cyber metrics should be
automated wherever possible. If a metric is genuinely important, it should not
depend on a busy analyst manually stitching exports together every time
someone asks for it.
The regular figures should be hard coded into the operating model: same
definition, same authoritative data source, same schedule, same recipients,
same limitation statement, same owner, and a review date. They should be
pushed to the right people at the right time. Not rebuilt from scratch by
whoever happens to know where the data lives.
If the business truly needs more reporting, then fund it properly. Build the data
pipeline. Give the reporting team access. Standardise the definitions. Use the
tooling already available. Hire someone with statistics, cyber context and
coding ability. Make it that person’s job to know where all this information is,
how reliable it is, and how to create repeatable reports from it. Do not keep
dragging SOC analysts away from the job and then act surprised when deeper
work is not getting done.
Before a new metric is requested, leadership should have to answer a few basic
questions:
- What decision will this support?
- Who owns the action if the number is bad?
- Who will investigate what is needed to fix it?
- Is the purpose understanding and improvement, or just chopping heads?
- Is this already reported somewhere else?
- What data source is authoritative?
- What are the exclusions?
- How much analyst time will this consume?
- What work will stop while this is produced?
- How often is it needed?
- Who receives it, and what are they expected to do with it?
- How will it be automated?
- When will we retire it?
That last question matters.
Reports have a habit of becoming permanent even after their original purpose has died. The automated email keeps going. The inbox ignores it. The business still pays the cost of maintaining the ritual.
A useful cyber metric should create action. It should reveal risk, track control
health, show operational performance, support a decision, or expose a broken
process that needs fixing. If it does none of those things, it is probably vanity
reporting. It probably will not even support a serious financial decision,
because the money conversation is only as good as the operational truth
underneath it.
Metrics should help the organisation understand. They should not exist so
leadership can say the board pack is green and move on.
Give it a rest with the stats. You cannot report your way out of poor security.
Cyber security has a measurement problem, but not because there are too few
numbers.
The problem is that too many organisations confuse numbers with control.
They confuse dashboards with visibility.
They confuse closure rates with investigation quality.
They confuse training completion with human resilience.
They confuse vulnerability percentages with actual exposure.
They confuse reporting with defence.
The graph is not the control. The dashboard is not the defence. The monthly
pack is not evidence that the organisation is safe.
Used properly, metrics help cyber teams see what is working, what is failing
and where the next hour of effort should go. Used badly, they become a tax on
the people doing the defending, and a very real risk to the business they are
trying to protect.
So yes, measure cyber security. Measure it properly. Automate what can be
automated. Build a dedicated reporting function if the business wants constant
figures.
But give it a rest with the random stats requests.
Because while someone is polishing the pie chart, the attacker is not waiting.
References
Anthropic (2025a) ‘Detecting and countering misuse of AI: August 2025’. Available at:
https://www.anthropic.com/news/detecting-countering-misuse-aug-2025
Anthropic (2025b) ‘Disrupting the first reported AI-orchestrated cyber espionage campaign’. Available at:
https://www.anthropic.com/news/disrupting-AI-espionage
Center for Internet Security (2024) ‘CIS Critical Security Controls Version 8.1’. Available at:
https://www.cisecurity.org/controls/v8-1
CISA (2023) ‘CISA Red Team Shares Key Findings to Improve Monitoring and Hardening of Networks’.
Available at: https://www.cisa.gov/news-events/cybersecurity-advisories/aa23-059a
Google Cloud (2026) ‘M-Trends 2026: Data, Insights, and Strategies From the Frontlines’. Available at:
https://cloud.google.com/blog/topics/threat-intelligence/m-trends-2026/
ISACA (2025) ‘State of Cybersecurity 2025 Global Press Release’. Available at:
https://www.isaca.org/about-us/newsroom/press-releases/2025/state-of-cybersecurity-2025-global-press-rele
ase
Microsoft (2026) ‘Manage your SOC better with incident metrics’. Microsoft Learn. Available at:
https://learn.microsoft.com/en-us/azure/sentinel/manage-soc-with-incident-metrics
National Cyber Security Centre (2024) ‘The near-term impact of AI on the cyber threat’. Available at:
https://www.ncsc.gov.uk/report/impact-of-ai-on-cyber-threat
NIST (2024) ‘SP 800-55 Volume 2, Measurement Guide for Information Security: Volume 2 – Developing
an Information Security Measurement Program’. Available at: https://csrc.nist.gov/pubs/sp/800/55/v2/final
Object First (2025) ‘Object First Survey: 84% of IT Pros Feel Uncomfortably Stressed at Work Amid Rising
Cybersecurity Threats’. Available at: https://objectfirst.com/newsroom/press-releases/object-first-survey-84-
of-it-pros-feel-uncomfortably-stressed-at-work-amid-rising-cybersecurity-threats/
Oxford Reference (n.d.) ‘Charles Goodhart’. Available at:
https://www.oxfordreference.com/display/10.1093/acref/9780191843730.001.0001/q-oro-ed5-00016814
Sophos (2025) ‘Report: Addressing cybersecurity burnout in 2025’. Available at:
https://www.sophos.com/en-us/blog/report-addressing-cybersecurity-burnout-in-2025
US House Committee on Oversight and Government Reform (2018) ‘Committee Releases Report Revealing
New Information on Equifax Data Breach’. Available at:
https://oversight.house.gov/report/committee-releases-report-revealing-new-information-on-equifax-data-bre
ach/
Verizon (2026) ‘2026 Data Breach Investigations Report’. Available at:
https://www.verizon.com/business/resources/reports/dbir/